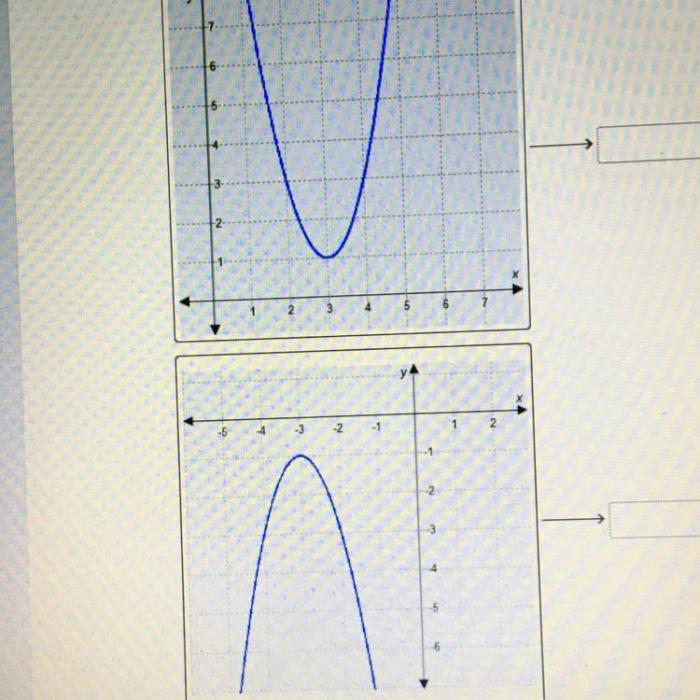
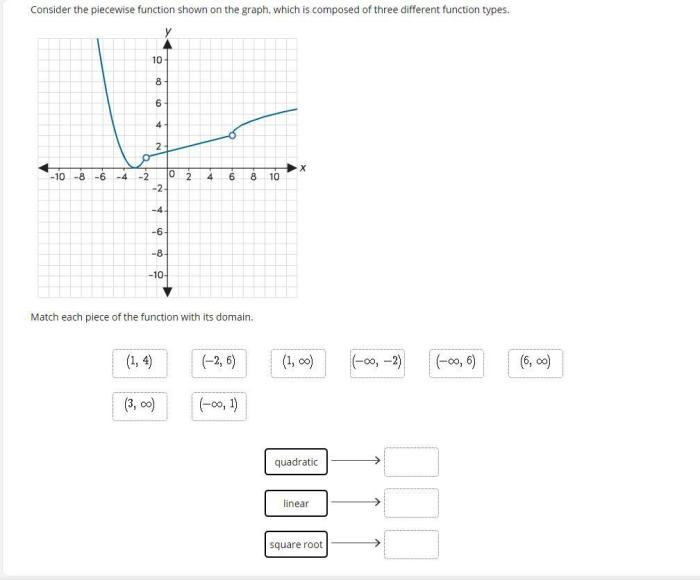
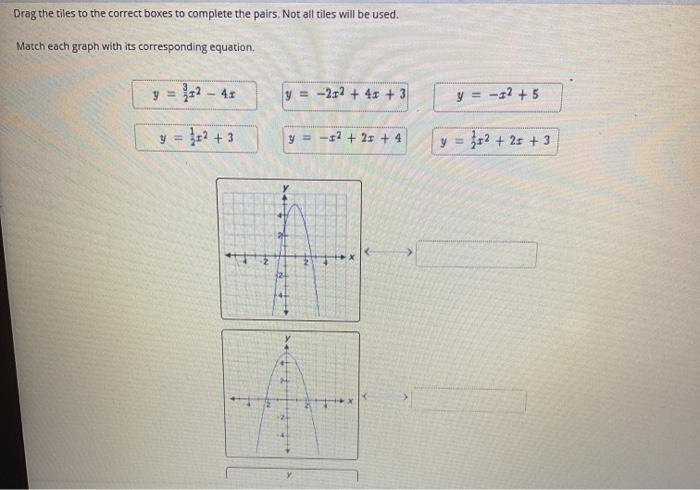
Match each quadratic function to its graph: an essential skill for understanding the behavior and applications of these ubiquitous mathematical functions. This guide provides a comprehensive overview of quadratic functions, their graphical representations, and the techniques for matching them effectively.
Quadratic functions, characterized by their parabolic shape, are widely used in various fields, from physics to economics. By mastering the ability to match quadratic functions to their graphs, students and practitioners can gain a deeper understanding of these functions and their practical implications.
Identify Quadratic Functions

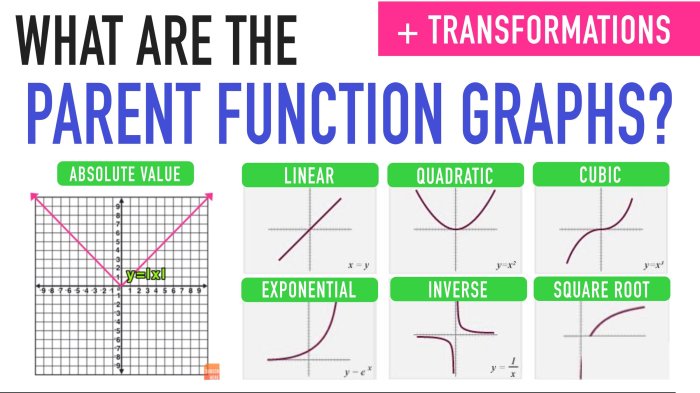
Quadratic functions are mathematical expressions of the form f(x) = ax² + bx + c, where a, b, and c are real numbers and a ≠ 0. These functions represent curves that open either upward or downward, forming a parabola shape.
Quadratic functions can be expressed in different forms:
- Standard form:f(x) = ax² + bx + c
- Factored form:f(x) = (x – r₁)(x – r₂), where r₁ and r₂ are the roots of the function
- Vertex form:f(x) = a(x – h)² + k, where (h, k) is the vertex of the parabola
Quadratic functions have several characteristic features:
- They are parabolic in shape, opening either upward or downward.
- They have two x-intercepts, which are the points where the parabola intersects the x-axis.
- They have a vertex, which is the highest or lowest point on the parabola.
Analyze Quadratic Graphs

Graphing quadratic functions involves plotting points and connecting them to form a smooth curve. To analyze the graph of a quadratic function, we examine its key features:
- Axis of symmetry:A vertical line that passes through the vertex and divides the parabola into two symmetrical halves.
- Vertex:The point on the parabola with the minimum or maximum value.
- Domain:The set of all possible x-values for which the function is defined.
- Range:The set of all possible y-values for which the function is defined.
We can determine the key features of a quadratic graph from its equation using the following formulas:
- Axis of symmetry: x = -b/2a
- Vertex: (h, k) = (-b/2a, f(-b/2a))
- Domain: (-∞, ∞)
- Range: [k, ∞) or (-∞, k], depending on the direction of the parabola
Match Functions to Graphs

Matching quadratic functions to their graphs requires comparing their key features. The axis of symmetry, vertex, and shape of the parabola provide important clues for matching:
- Axis of symmetry:The graphs of functions with the same axis of symmetry will be symmetric with respect to that line.
- Vertex:The graphs of functions with the same vertex will have the same minimum or maximum point.
- Shape:The graphs of functions with the same sign of the leading coefficient (a) will open in the same direction (upward or downward).
An interactive table or visual representation can be helpful for organizing and comparing the key features of multiple functions and graphs.
Applications and Examples

Matching quadratic functions to graphs is a useful skill in various fields:
- Physics:Modeling projectile motion, where the height of a projectile is a quadratic function of time.
- Economics:Optimizing revenue by finding the quadratic function that best fits a set of data points representing revenue versus price.
- Engineering:Designing parabolic structures such as bridges and satellite dishes.
Practice problems and exercises can reinforce the understanding of the matching process and its applications.
Helpful Answers: Match Each Quadratic Function To Its Graph
What are the key features of a quadratic function?
Quadratic functions are characterized by their parabolic shape, a vertex (minimum or maximum point), and an axis of symmetry.
How do I determine the key features of a quadratic function from its equation?
The equation of a quadratic function in vertex form (y = a(x – h)^2 + k) provides the vertex coordinates (h, k) and the axis of symmetry (x = h). The coefficient ‘a’ determines the parabola’s opening direction and steepness.
What are some real-world applications of matching quadratic functions to graphs?
Matching quadratic functions to graphs finds applications in projectile motion, revenue optimization, population modeling, and many other areas.